
Tracing in the Buildkite agent
Distributed tracing with OpenTelemetry lets you gain more insight into the performance of your CI runs - what's fast, what's slow, what could be optimized, and how these things change over time. You can forward OpenTelemetry traces to observability platforms such as Datadog and Honeycomb.
Using OpenTelemetry tracing
Before starting the Buildkite agent, install and configure an OpenTelemetry Collector. Learn more about this from OpenTelemetry's Install the Collector page of their documentation.
Once the Collector is up and running, start the Buildkite agent with:
buildkite-agent start --opentelemetry-tracing
This will enable OpenTelemetry tracing, and start sending traces to an OpenTelemetry Collector.
The Buildkite agent's OpenTelemetry implementation uses the OTLP gRPC exporter to export trace information. This means that there must be a Collector capable of ingesting OTLP gRPC traces accessible by the Buildkite agent. By default, the Buildkite agent exports trace information to localhost:4317. Set the OTEL_EXPORTER_OTLP_ENDPOINT environment variable when starting the agent to use a different Collector endpoint.
Once traces are being sent, you can view the internal state of the collector by visiting the TraceZ debug interface:
http://localhost:55679/debug/tracez
This interface shows active and sampled spans and is helpful for troubleshooting your OpenTelemetry trace pipeline.

The Buildkite agent defaults to the grpc transport for OpenTelemetry. Set the OTEL_EXPORTER_OTLP_PROTOCOL environment variable to http/protobuf to use HTTP instead.
To set the OpenTelemetry service name, provide --telemetry-service-name example-buildkite-agent. The default service name is buildkite-agent.
The agent automatically accepts trace context from the Buildkite control plane and propagates it through the agent's trace spans.
Learn more about configuring the OpenTelemetry integration with Buildkite Pipelines from the OpenTelemetry integrations page.
Trace context propagation
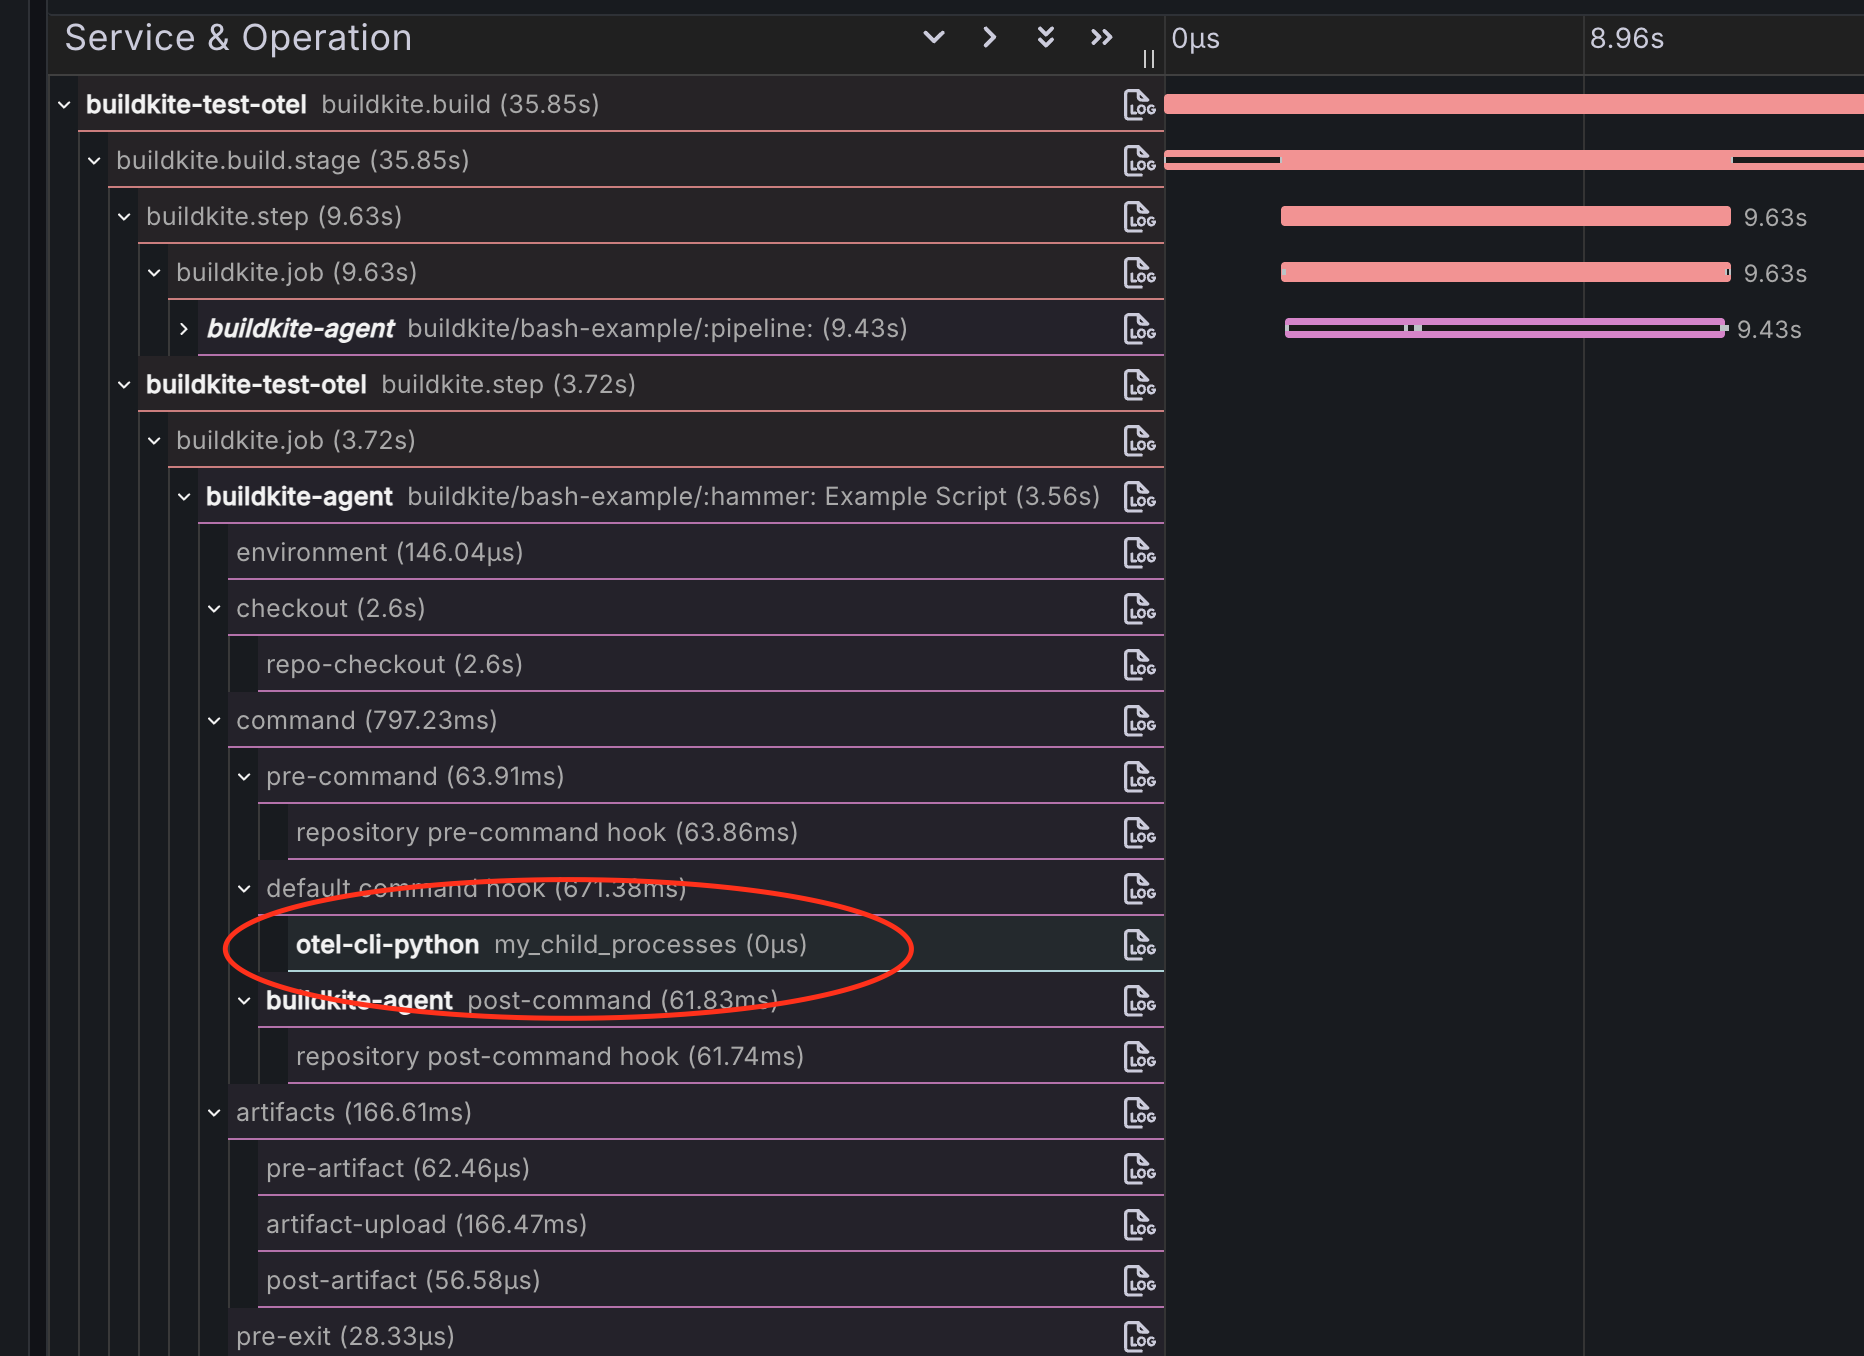
Starting from Buildkite agent version v3.100, when a Buildkite agent executes a command (build script, hook, plugin, and so on), the current trace context is automatically propagated to the child process using environment variables. This enables distributed tracing across job boundaries, and your build scripts can continue the trace started by the agent or the Buildkite Pipelines backend.
The agent serializes the trace context into multiple formats for compatibility with various tracing libraries:
| Environment Variable | Format |
|---|---|
| TRACEPARENT, TRACESTATE | W3C Trace Context |
| UBER_TRACE_ID | Jaeger |
| X_B3_TRACEID, X_B3_SPANID, X_B3_SAMPLED | Zipkin B3 |
| X_AMZN_TRACE_ID | AWS X-Ray |
The environment variable names follow the OpenTelemetry Environment Variable Carriers specification.
To continue the trace in your build script, configure your tracing library to extract context from the environment variables. For example, with the OpenTelemetry SDK, you can read the TRACEPARENT variable and create a child span that links back to the agent's span.
Sending OpenTelemetry traces to Honeycomb
To send traces to Honeycomb, enable OpenTelemetry tracing and set the following environment variables. Replace the API token in OTEL_EXPORTER_OTLP_HEADERS with the token provided by Honeycomb.
export BUILDKITE_OPENTELEMETRY_TRACING="true"
# service name is configurable
export BUILDKITE_TELEMETRY_SERVICE_NAME="buildkite-agent"
# use the gRPC transport
export OTEL_EXPORTER_OTLP_PROTOCOL="grpc"
# the gRPC transport requires a port to be specified in the URL
export OTEL_EXPORTER_OTLP_ENDPOINT="https://api.honeycomb.io:443"
# authentication of traces is done via the API key in this header
export OTEL_EXPORTER_OTLP_HEADERS="x-honeycomb-team=xxxxx"
Exporting job logs as OpenTelemetry logs
From Buildkite agent version v3.135.0, the agent can export job log output as OpenTelemetry log records, in addition to the regular Buildkite job log. Job log export is opt-in. When enabled, job output is emitted as OpenTelemetry log records, and the normal Buildkite job log stream that appears in the Buildkite dashboard is unchanged.
Exported records reuse the OTLP exporter configuration that the agent already reads for OpenTelemetry tracing. You can send job logs to the same collector or backend that receives agent traces.
Enabling job log export
Job log export is independent of tracing, so you can turn it on with or without --opentelemetry-tracing. Start the agent with the --job-logs-otlp flag:
buildkite-agent start --job-logs-otlp
You can also enable it with the BUILDKITE_JOB_LOGS_OTLP environment variable:
export BUILDKITE_JOB_LOGS_OTLP=true
Job log export is an operator setting
A pipeline cannot turn job log export on or off. The agent overwrites BUILDKITE_JOB_LOGS_OTLP in each job environment with the value configured when the agent started, so the setting is controlled by whoever operates the agent.
Configuring the endpoint
Job log records are sent using the standard OpenTelemetry OTLP exporter environment variables. The agent reads the log-specific OTEL_EXPORTER_OTLP_LOGS_* variables first, then falls back to the generic OTEL_EXPORTER_OTLP_* variables, matching the OpenTelemetry SDK environment variable specification.
| Environment variable | Description |
|---|---|
OTEL_EXPORTER_OTLP_LOGS_ENDPOINT or OTEL_EXPORTER_OTLP_ENDPOINT
|
Endpoint of the OTLP collector or backend that receives the log records. For http/protobuf, set the log-specific variable to the complete logs endpoint (for example, http://otel-collector:4318/v1/logs). The exporter appends /v1/logs to the generic endpoint. |
OTEL_EXPORTER_OTLP_LOGS_HEADERS or OTEL_EXPORTER_OTLP_HEADERS
|
Headers sent with each export request, for example, an authentication token. |
OTEL_EXPORTER_OTLP_LOGS_PROTOCOL or OTEL_EXPORTER_OTLP_PROTOCOL
|
Transport protocol: grpc (default) or http/protobuf. |
The service name defaults to buildkite-agent. When OpenTelemetry tracing is also enabled, it follows the --telemetry-service-name flag.
The following example sends job logs to a local collector over HTTP, using the http/protobuf protocol recommended by the OpenTelemetry specification:
export BUILDKITE_JOB_LOGS_OTLP=true
export OTEL_EXPORTER_OTLP_ENDPOINT="http://otel-collector:4318"
export OTEL_EXPORTER_OTLP_PROTOCOL="http/protobuf"
buildkite-agent start
What each record contains
Each record carries a line of job output as its body, with the same [REDACTED] markers as the Buildkite job log. Records are built from the already-redacted job log stream, so they inherit the job log redaction automatically, including secrets split across separate writes and secrets added mid-job through the Job API. Lines longer than the maximum record size of 64 KiB are split across multiple records. Both child-process output and the bootstrap control output, such as section headers, prompts, comments, and warnings, are exported, so the records match the downloadable Buildkite job log.
Each record is emitted at INFO severity and is timestamped with the arrival of the line's first byte, matching the start-of-line semantics of the Buildkite job log. The following resource attributes are set on every record:
| Attribute | Description |
|---|---|
service.name |
Service name (default: buildkite-agent). |
service.version |
Buildkite agent version. |
deployment.environment |
Always ci. |
The following attributes identify the source job on every record:
| Attribute | Description |
|---|---|
source |
Always job. |
buildkite.organization.slug |
Organization slug. |
buildkite.pipeline.slug |
Pipeline slug. |
buildkite.branch |
Build branch. |
buildkite.queue |
Agent queue. |
buildkite.agent |
Agent name. |
buildkite.agent.id |
Agent ID. |
buildkite.build.id |
Build ID. |
buildkite.build.number |
Build number. |
buildkite.job.id |
Job ID. |
buildkite.job.label |
Job label. |
buildkite.job.key |
Step key. |
Job output is exported in full
Redaction only masks values the agent recognizes as secrets, such as redacted environment variables and secrets registered through the Job API. Any other sensitive content that a build prints is exported to the configured OTLP endpoint. Treat that endpoint as handling sensitive data, and prefer an encrypted transport for anything beyond a trusted local collector.
Correlating logs with traces
When the agent also runs with OpenTelemetry tracing enabled, each log record is correlated with the trace of the job that produced it. Every record carries the trace ID and the span ID of the nearest enclosing phase or hook span at the time the line is emitted, falling back to the root job span. This lets you pivot from a trace span to the log lines it produced in a backend that supports log-to-trace correlation.
Records carry the enclosing phase or hook span rather than a more specific child operation span. When tracing is disabled, records are still exported, but without trace correlation.